One of the most critical priorities for any business is retaining their customers for as long as possible. You want to keep your customers happy so they come back to spend more.
Data science can help businesses keep customers longer. Using business data, a data scientist can develop a model that predicts if and when each customer will end their relationship with a business (or “churn”). These models allow businesses to identify the customers who are most at risk of churning. Once a company has identified these customers, it can try to retain them—maybe by offering them incentives, explaining how the customer can get more use out of the product, or just checking in to see if the company can do anything to make these customers happier. Empowered by a predictive model, the company can repeat this process every couple of months to stay ahead of churn, incorporate feedback to improve the product, and improve long-term retention.
These models can also help businesses understand their customers better. Together with models that forecast revenue from customers, a model for customer retention can predict the lifetime value of individual customers—how much in today’s dollars the entire relationship with a customer will be worth. Lifetime value is a crucial tool to understand which customers are most important to retain, how much you should be willing to spend to retain them, and which prospects are the most valuable to target.
In addition, once businesses know what kinds of customers tend to churn fastest, they have a better idea of what kinds of customers are the most valuable to try to acquire in the first place. They can take that into account when they are deciding what kinds of customers they should market to or choosing which prospects their sales team should focus on.
A Model For Customer Retention
Recently, scholars at the Wharton School at the University of Pennsylvania and the London Business School developed a technique for valuing businesses with subscription pricing models (version for free download here). Their technique uses what they call a “bottom-up” approach: they estimate the value of each individual customer, predict how many customers the company will have in the future, and add up those predictions to estimate how much the company is worth.
I am using this technique to analyze data from Buffer, an online subscription-based firm that publicly releases much of its financial data. The first step I took was to develop a model to forecast how long customers stick around before they cancel their subscriptions. Using this model, I can predict how many of Buffer’s customers will churn every month.
I developed my model without any data about Buffer’s individual customers, since Buffer doesn’t make customer data publicly available. With access to data on a business’s customers, I could take into account the characteristics of individual customers to provide more accurate customer-level predictions, and I could identify the kinds of customers who are at risk of churning soonest.
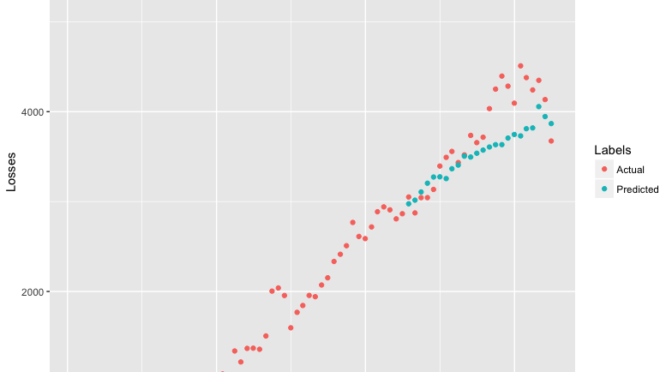
Here’s a plot showing my model’s predictions. The actual number of subscribers Buffer lost every month since they founded the company in January 2012 are shown in red. The number of lost customers my model predicted for each month are shown in blue. My data go until August 2018, which is when I fit the model.

Checking The Model
The model looks great fitted to past data, but what we’d really like to know is how well it will fit future data. To get some insight on that, I refit the model using only the data up until June 2016. Then I checked how the model’s predictions did over the next two years of data compared to the actual numbers of subscribers Buffer lost each month.

The fit is still fairly strong, despite the fact that Buffer’s loss numbers became more erratic in this interval than they were in the past. That suggests that my model should make good predictions about Buffer’s churn going into the future.
Business Insights
This model allows me to find a few insights about Buffer’s business. For one, I can calculate the expected remaining contract length (or “residual lifetime”) for customers in each cohort. According to my model, customers acquired in January 2012 who are still active as of the end of June 2018 will keep their subscriptions for an average of 20.9 more months. On the other hand, customers acquired in May 2018 who are still active as of the end of June 2018 will only have their subscriptions last another 18.7 months on average.
This makes sense because customers who have been with a company for a long time tend to stick around longer. In other words, longstanding customers tend to have higher retention rates than new customers. However, in the case of Buffer, this effect seems to be noticeably modest. Having a subscription with Buffer for an extra six and a half years only boosts the expected residual lifetime by about two months.
I can also use my model to predict the percentage of Buffer’s current customers who were acquired in each cohort, as well as the percentage of customers from each cohort who still have subscriptions active.
This graph shows the percentage of Buffer’s current customer base that my model estimates were acquired in each year of Buffer’s operations, year 1 being 20121. As you would expect, a higher percentage of Buffer’s current customers were acquired recently, because they haven’t had as much time to churn. Also, more of Buffer’s customer base is made of customers acquired in 2017 than customers acquired in 2018, because 2018 was only about half over when I fit my model in August.

This graph shows the raw numbers of Buffer’s current customers by year of acquisition, as estimated by my model. For example, this graph shows that Buffer currently has almost 30,000 customers who were acquired during 2017, according to my model’s estimates.

Next Steps
To complete the methodology, there are two more models I need to develop. This first is a model for customer acquisition that predicts how many customers Buffer will acquire each month going forward. The second is a model for average revenue per customer, or average revenue per user (ARPU).
When my model for customer acquisition is complete, I can forecast how many customer’s Buffer will gain in the future, how many customers will churn, and what their overall number of customers will be at any given time.
After completing my model for Buffer’s ARDU, combined with my forecasts for Buffer’s numbers of customers going forward, I will be able to value Buffer as a company. I will also be able to estimate what the lifetime value of customers in each cohort is. Of course, with customer-level data from Buffer, I could provide more insight about what kinds of Buffer’s customers are likely to be most profitable and have the longest subscription durations.
In a future blog post, I will write about the model McCarthy, Fader, and Hardie used for customer churn, as well as how I fit a model to Buffer’s data.